

1. Introduction
2. Physical description of the problem
3. CFD methodology
3.1 Governing equations
3.2 Modeling & setting conditions
3.3 Grids & validation
4. Results
4.1 Flow comparison
4.2 Investigation of radial back flow factor
5. Conclusions
1. Introduction
The single-wafer wet cleaner is a cleaning equipment used in the semiconductor manufacturing process to perform cleaning processes on wafers one at a time. It is characterized by executing processes for individual wafers within a single chamber. In this equipment, a wafer is mounted on a structure within a chamber, rotating subject to chemical or physical treatment. The performance of the cleaning process is assessed in terms of the size and quantity of particles, and recent advancements in semiconductor technology have led to the management of particles even smaller than 30 nm. As the particle size decreases, issues arise in the post processing, where particles are re-adsorbed onto the wafer due to internal flow within the chamber, influenced by factors such as flow patterns and electrostatic forces. This study aims to investigate the flow generated by the internal structure of the chamber.
The internal structure of the chamber, which is the focus of this study, has a complex shape, including a rotating disk. Generally, the flow on a rotating infinite disk has been reported to exhibit an increase in radial velocity near the wall, with induced axial flow [1,2]. Furthermore, during the transition from laminar flow to turbulent flow in the rotational flow on the disk, the generation of spiral vortices has been reported. It has been noted that as the rotational speed or the diameter of the disk increases, a specific Reynolds number is reached, leading to the occurrence of up to 29-31 vortices. Additionally, a transition to complete turbulent flow is reported when the Reynolds number reaches 3.2×10⁵[3,4,5]. The flow at the boundary layer of the rotating disk is known to undergo a rapid transition to turbulence due to three-dimensional flow, and research on the instability of the flow is ongoing [6,7,8,9,10,11]. For two coaxially installed disks, the flow variation with the rotational speed and the gap size between the two disks has been reported. When the coaxial disks rotate at the same speed, the flow between the disks is characterized by a solid-body rotating flow region moving with the disks and an irregular flow region separated from each other. Particularly at the edge of the disk, irregular flow characteristics resulting from the collision of flow exiting radially from the wall and flow being suctioned radially between the two disks have been reported [12]. In the case of a cylindrical shape, vortex formation has been reported for flow parallel to the axis, and it is considered fully developed turbulent flow at Reynolds numbers ranging from 300 to 3.0×10⁵[13].
Generally, studies have been conducted to interpret the process of liquid supplied to the rotating disk as it covers the upper surface and is sprayed. Changes in liquid film flow due to liquid supplied to the center of the rotating disk are reported to cause hydraulic jumps due to the inertia of the supplied liquid [14]. The liquid film covering the upper surface of the rotating disk undergoes a process where a thin annular form of ligament and droplets are separated at the edge, and as the rotational speed increases, the diameter of the ligament and the size of the droplet tend to decrease [15]. Various studies have been conducted on the process of liquid being supplied to the rotating disk, and the characteristics of the flow sprayed by variables such as flow rate, angular velocity, disk diameter, liquid density, and surface tension have been investigated. The liquid sprayed has been categorized into sheet mode, ligament-sheet mode, and droplet-ligament mode, and the influence of variables has been reported [16,17,18,19]. Recently, CFD analysis has been performed for the entire process of spraying from the moment the liquid is supplied to the rotating disk. For the analysis, the entire domain was separated, and using the Ansys Fluent tool, an analysis of the liquid film on the upper surface of the disk using the VoF technique was performed. The results were used to interpret the ligament-droplet mode using the DPM technique at the disk edge. The analysis time for each domain was reported to be approximately 4000 hours when 40 CPUs were connected in parallel [20].
In our study, to save the cost of flow analysis with the liquid supplied, we assumed that the liquid colliding with surrounding structures due to the rotational force is transformed into particles of various sizes. We assumed the presence of particles capable of moving along the radial backflow conditions within the chamber and aimed to investigate the factors and variables that generate such backflow.
2. Physical description of the problem
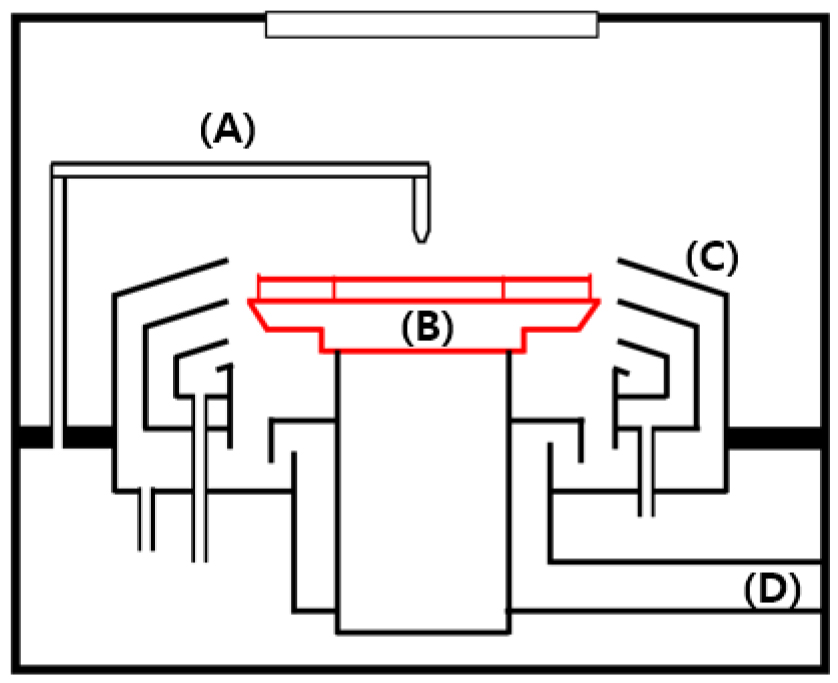
The wet cleaning process involves subjecting a rotating wafer to chemical or physical treatments. Following these treatments, the wafer surface is wetted with de-ionized water(Diw). Subsequently, the supply of Diw is halted, and the wafer undergoes a final step of rotation at 1800 rpm for drying the surface. In this study, we investigated the flow generated during the final step of drying the Diw on the wafer surface at 1800 rpm. Fig. 1 is a schematic of the internal structure of the chamber where the cleaning process takes place. The chamber where the wet cleaning process takes place typically consists of a nozzle (A) supplying the cleaning solution and a structure (B) holding the wafer in a rotating state. Additionally, there is a structure (C) in a guide shape for recovering the cleaning solution supplied from the nozzle and an exhaust device (D) for removing fumes generated from the cleaning solution.
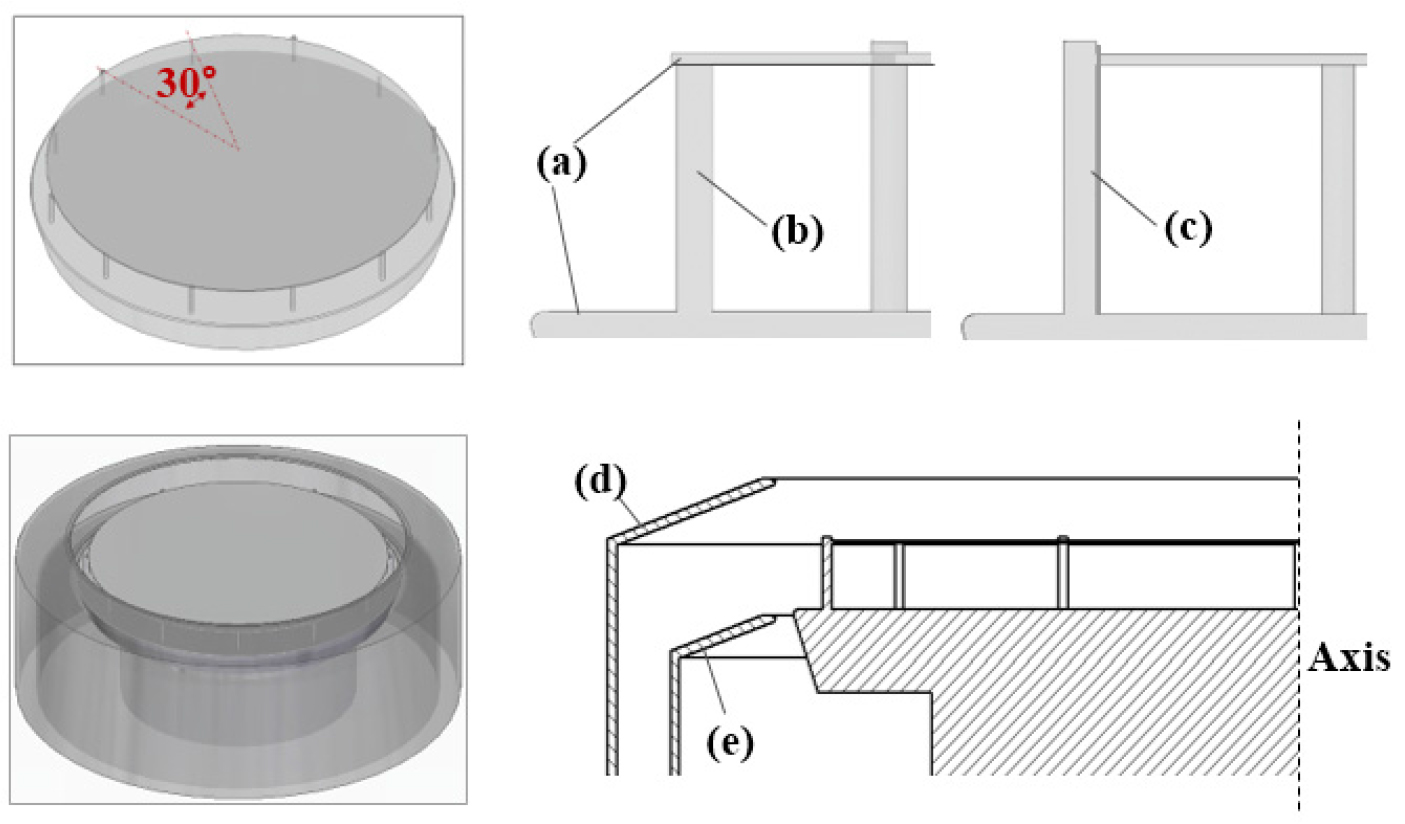
However, in this study, we focus on the flow generated by the rotating structure and surrounding guide shapes, excluding the consideration of multiphase flow involving a mixture of liquid and gas. The structure rotating with the wafer fixed in place consists of coaxial disks with different sizes, along with sub pins for suspending the wafer in the air and fixed pins to prevent slippage of the wafer. The two types of pins are installed at 30-degree intervals. The disk on the coaxial disk represents the wafer with a diameter of 300 mm and a thickness of 0.8 mm. The diameter of the lower disk is 325 mm. Both types of pins have a diameter of 3 mm, with lengths of 20 mm and 21.8 mm for each pin. Two guides, positioned for the purpose of liquid collection, are configured on the side of the rotating structure. The spacing between the two guides is 41.4 mm, with an inner diameter of 336.5 mm. Their respective outer diameters are 397 mm and 437 mm. We investigated the flow occurring between the rotating structure and surrounding structures under actual operating conditions, focusing on the flow entering in the wafer direction.
3. CFD methodology
3.1 Governing equations
In our study, we consider the scenario of rotating the wafer for drying in the final stage of the cleaning process. Therefore, the radius of the wafer structure is fixed at 0.15 m. The Reynolds number is defined at the wafer edge, . Specifically, when the rotation speed is 1800 rpm, . Here, represents the radius of the wafer, 𝛺 is the angular velocity, and 𝜈 is the kinematic viscosity of the fluid. In our research model, we obtained Reynolds numbers close to turbulent flow in some regions near the wafer edge.
However, in this study, we not only investigate the flow generated by the complex rotating structure but also examine the flow variations with respect to the rotational speed over the entire shape. As a result, we deal with a flow that combines laminar and turbulent flows. Therefore, in this study, a laminar solver that directly solves the Navier-Stokes equations for laminar flow is commonly used. To investigate the turbulent flow, a greater number of grids are constructed, and transient analysis is conducted. The governing equations used for the laminar solver are expressed in Eq. (1) and (2).
Eq. (3), (4) and (5) are dimensionless velocity components used to assess whether the flow has sufficiently developed, through comparison against the solution over an infinite disk. Here, , and represent the radial, circumferential, and axial velocity components, respectively [1,2].
3.2 Modeling & setting conditions
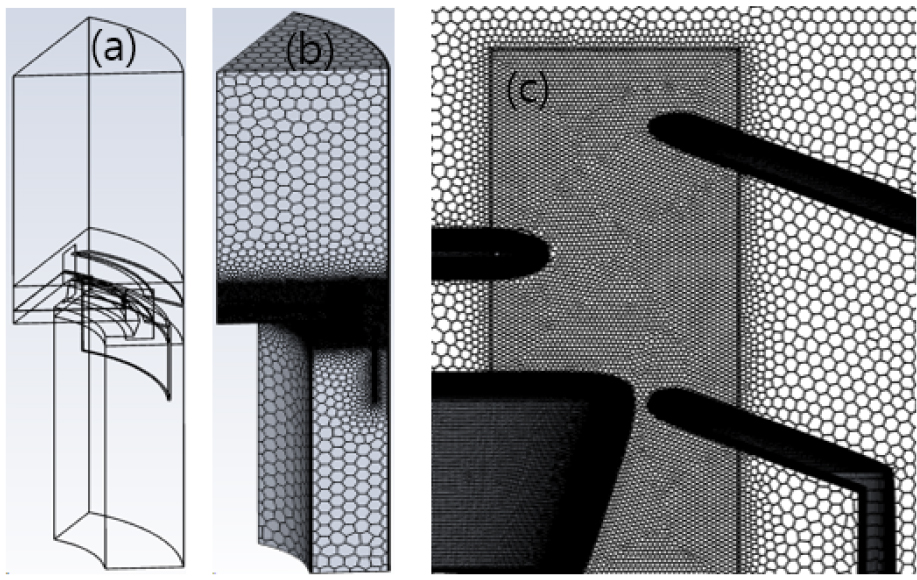
The two types of pins included in the rotating structure are located at 30-degree intervals, and to save computational costs in the analysis, the domain is set at a 60-degree angle with periodic conditions imposed, as shown in Fig. 2.
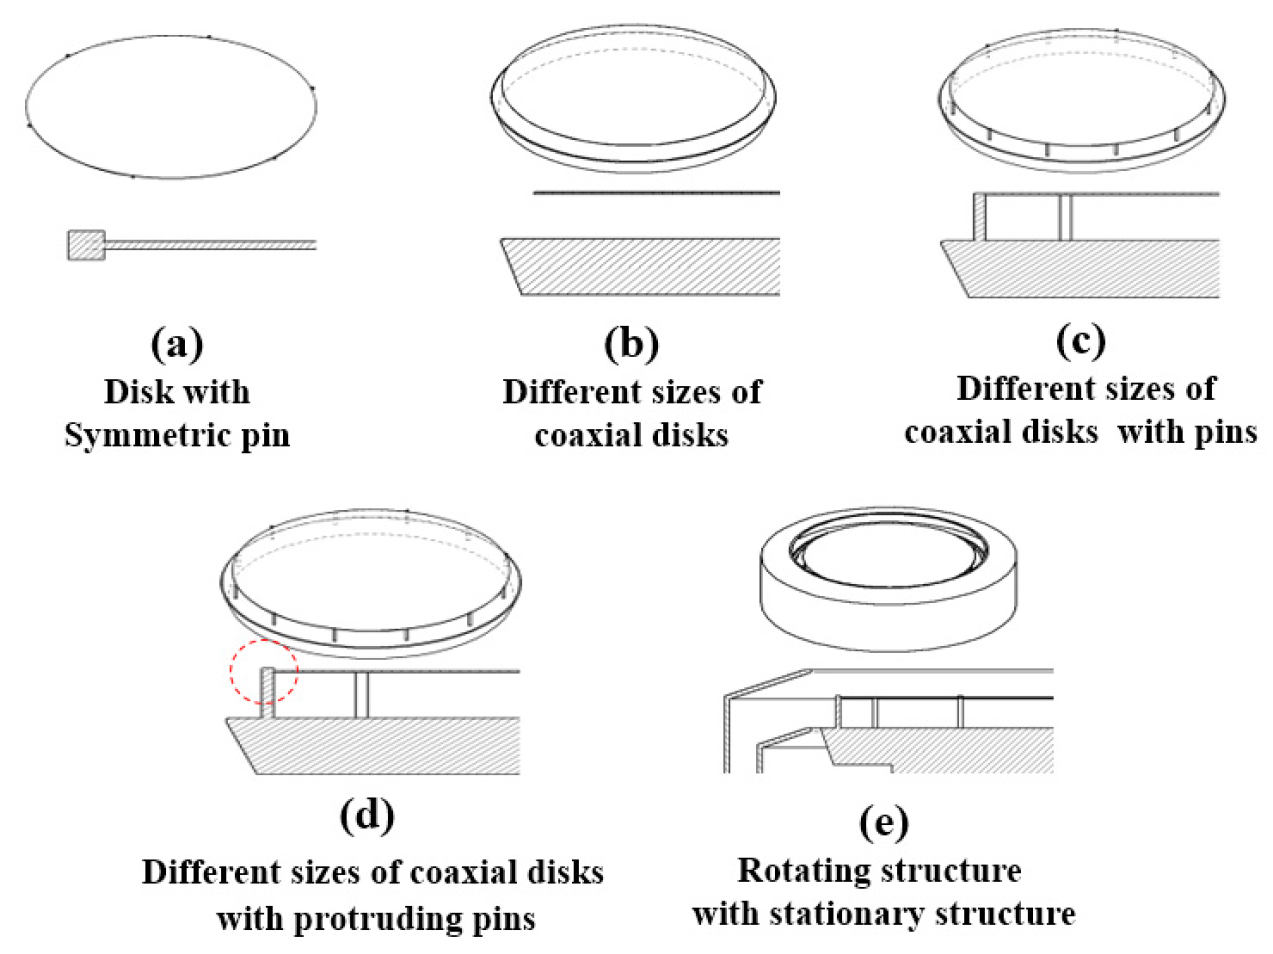
Before observing the flow between the rotating structure and surrounding structures, simulations were conducted to obtain reliable results for the flow generated by the rotating structure. To ensure accurate results for the flow generated by the complex-shaped rotating structure, a stepwise approach was taken, gradually adding shapes from a simple rotating structure to the entire structure. Analysis was conducted for five configurations, as shown in Fig. 3, to obtain precise results for the flow generated by the complex-shaped rotating structure.
We aimed to investigate the flow characteristics based on each shape of the rotating structure. For the analysis of the flow between the entire rotating structure and the surrounding structures, we intended to observe how changes in rotational speed or exhaust pressure values would affect the flow. The conditions used in the analysis are summarized in Table 1. To save costs during transient analysis, a CFL number of 5 was employed, with a corresponding time step size of 1e-06s, and the analysis was conducted over a total time of 0.19998s. This approach allowed for cost-effective exploration of how changes in rotational speed or exhaust pressure values influence the flow between the entire rotating structure and surrounding structures.
Table 1.
Setting conditions
| Inlet | 0 m/s |
| Outlet | -80 ~ 0 Pa |
| Rotation Speed | 0 ~ 2500 rpm |
| Material | Air |
| Time Step Size | 1e-06 s |
| CFL Number | 5 |
| Total Time | 2 s |
3.3 Grids & validation
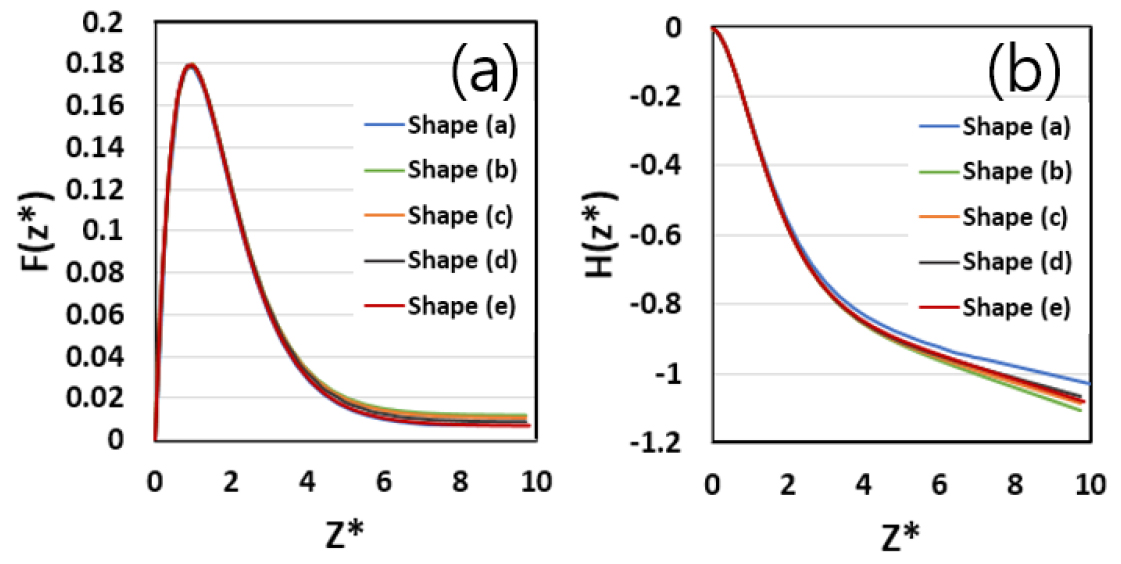
The grid used in the analysis was constructed using the Fluent Meshing tool in a polyhedral shape. To save computational costs, a dense mesh was created near the structure, particularly around the pins of the rotating structure, allowing for the observation of small-scale flow variations. In our study, using the laminar solver and conducting an analysis for the rotating structure, a dense mesh was created near the walls to ensure sufficient development of the flow in the viscous boundary layer. The mesh density was validated by comparing the numerical results with Von Karman's analytical solution. [1,2]Fig. 4 confirms the formation of 30 layers within the height satisfying z* = 10, producing values similar to Von Karman's results. This mesh configuration was uniformly applied to all grids for the analysis.
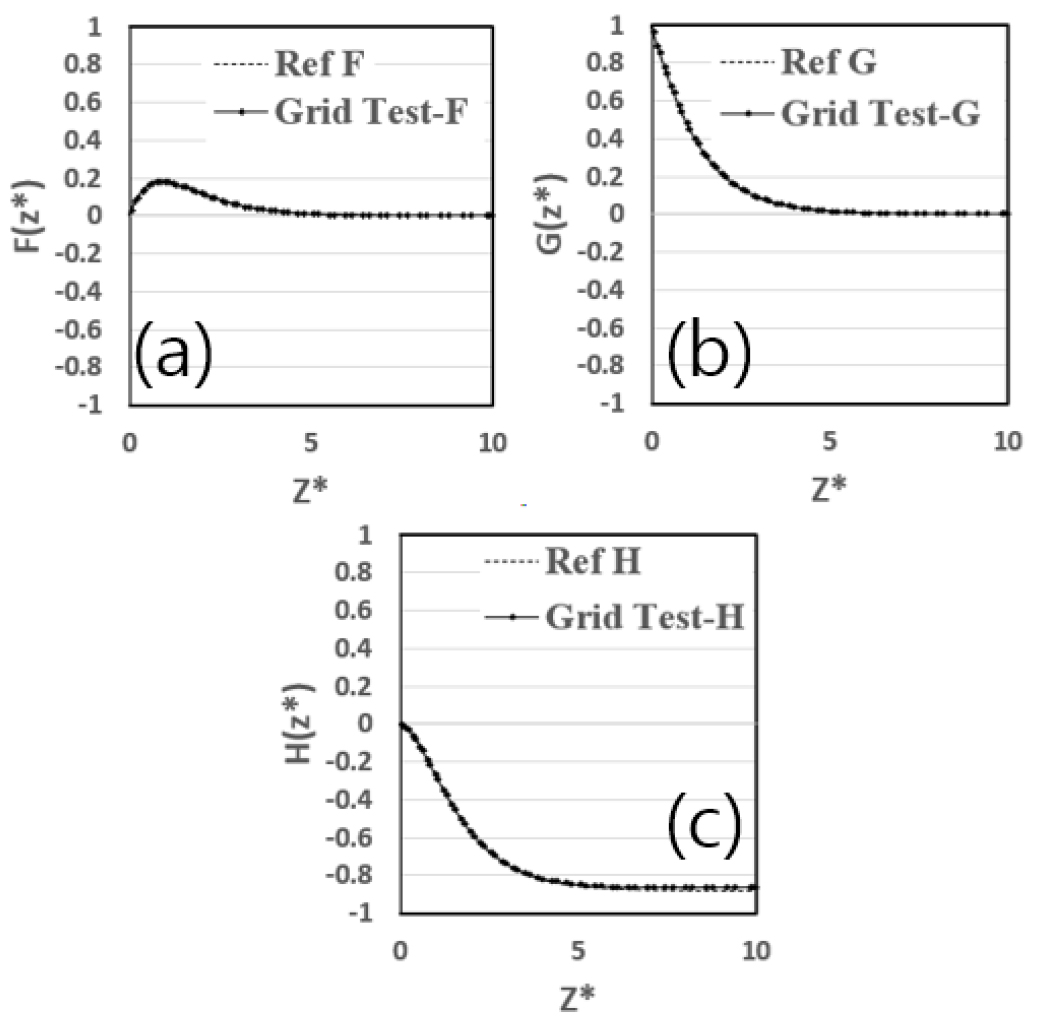
Fig. 5 illustrates the grid structure for configuration (c). (1) Thirty layers were constructed to facilitate flow development near the wall, and (2) a denser grid was created in the region where the pin is located.
4. Results
4.1 Flow comparison
To ensure reliable results for the entire shape, we systematically investigated the characteristics of rotational flow by progressively adding components from a simple shape (a) to the complete structure shape (d). This stepwise approach allowed for a comparison of results at each stage to validate the accuracy of the findings for the overall configuration.
4.1.1 Velocity profile in wall viscous boundary layer
The velocity profiles at the boundary layer on the wafer surface of the rotating structure are compared in Fig. 6. While the radial velocity component shows similar results across all configurations, noticeable variations can be observed in the axial velocity component as shapes are added. Particularly, in the configuration with the coaxial disk shape (b), the highest axial suction velocity component was identified, and with the addition of shapes, a decrease in the magnitude of the suction flow was observed. This indicates the effect of hindering the flow suction in the axial direction as pin shapes are introduced.
4.1.2 Radial velocity outside the viscous boundary layer
To observe the radial back flow in the direction of the rotation center, radial velocity profiles are compared from the wafer surface to a height of 50 mm outside the boundary layer. Fig. 7 presents the mean radial velocity profiles for all shapes composed solely of the rotating structure.
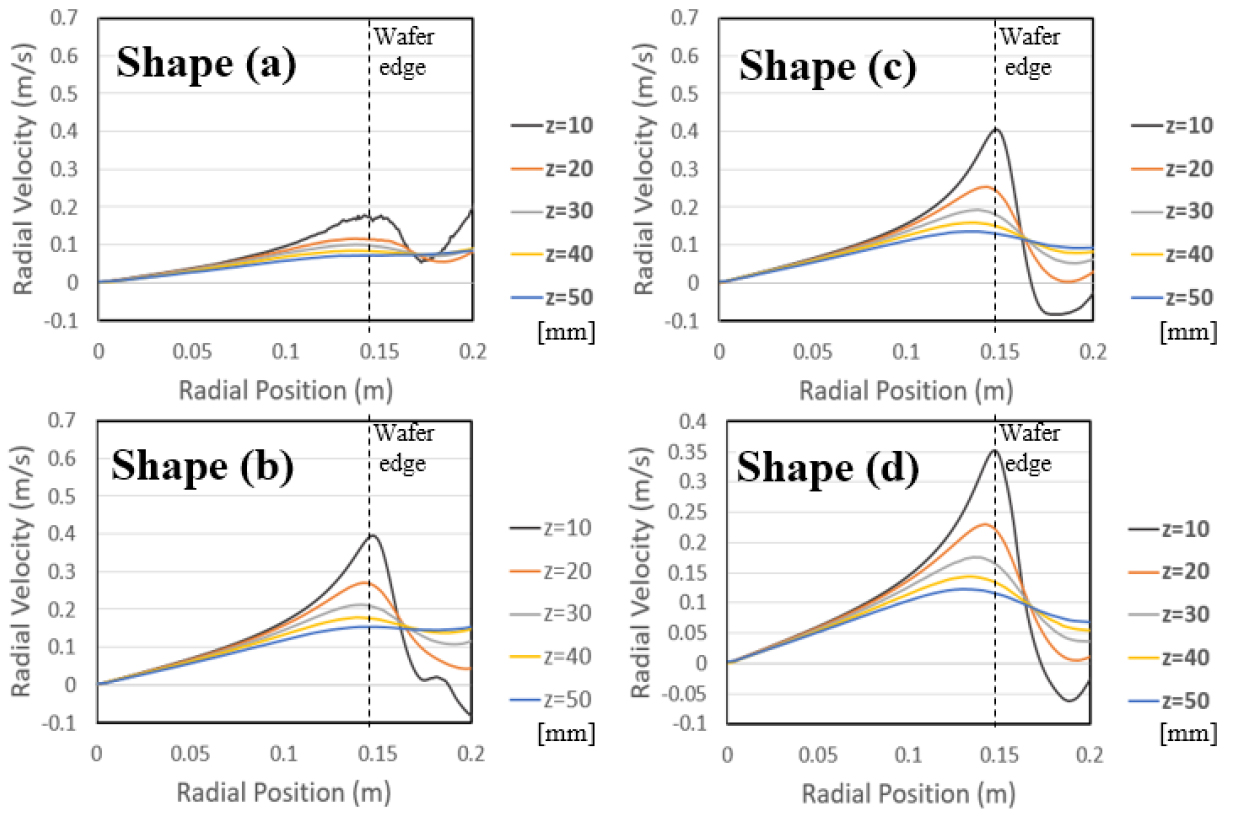
Examining the radial velocity component for each shape reveals that radial back flow does not occur on the upper surface of the wafer. However, shapes (b), (c), and (d), all featuring the coaxial disk shape, exhibit similar-sized radial velocity magnitudes at the wafer edge, and radial back flow occurs at the wafer side positions.
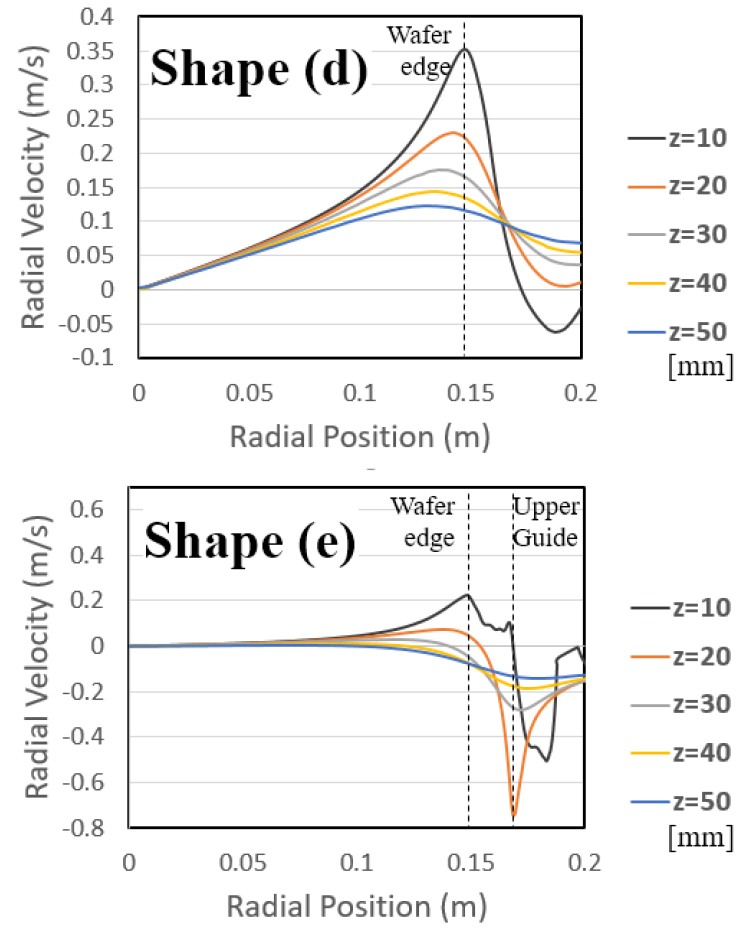
The results for shape (d) and the final shape (e) are compared and presented in Fig. 8. In the case of shape (e), the influence of the structure installed on the side of the wafer is evident, resulting in radial back flow not only on the side of the wafer but also at the upper surface of the wafer. Additionally, it was observed that the largest radial back flow occurs at the edge of the upper guide in shape (e).
4.2 Investigation of radial back flow factor
To assess the factors influencing radial back flow in the final shape (e), variations in rotational speed conditions and exhaust pressure conditions were introduced, and the results are compared.
4.2.1 Comparison of flow rate at outlet
In the final shape (e), the mass flow rate exhausted through the outlet of the domain was examined with variations in exhaust pressure and rotational speed for the entire domain. Fig. 9 investigates the results of changing the exhaust pressure while fixing the rotational speed at 1800 rpm and explores the mass flow rate variation with increasing rotational speed when the exhaust pressure is fixed at –65 Pa.
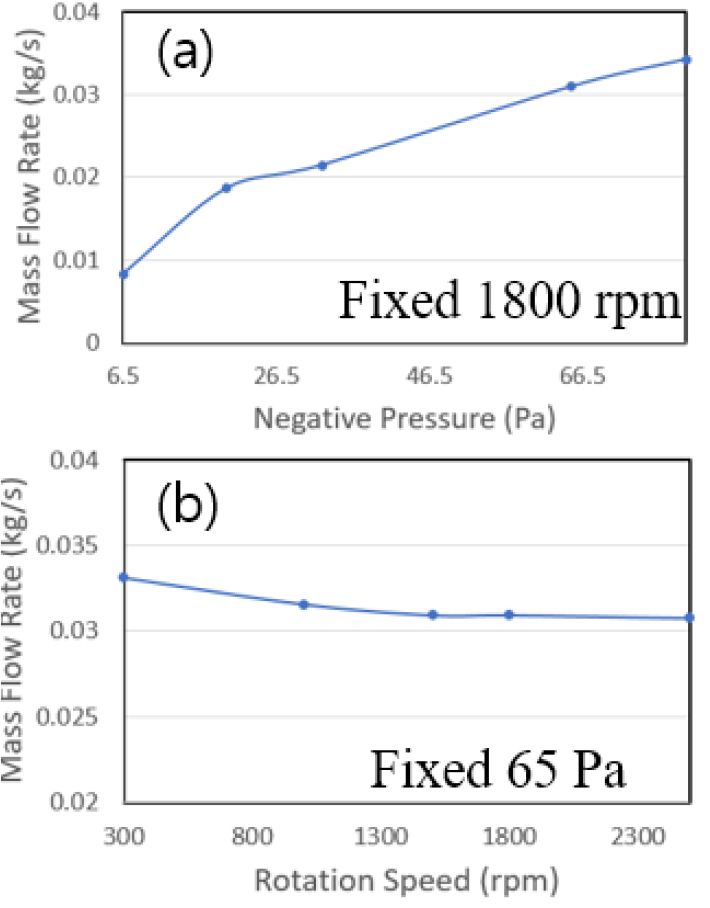
When the rotational speed is fixed at 1800 rpm, an increase in exhaust pressure leads to an observed increase in mass flow rate, indicating that exhaust pressure has a more significant impact on the overall flow than rotational speed. On the other hand, with exhaust pressure fixed at –65 Pa, an increase in rotational speed results in a decrease in mass flow rate. This observation suggests that the irregular flow generated with varying rotational speed influences the exhausted flow rate.
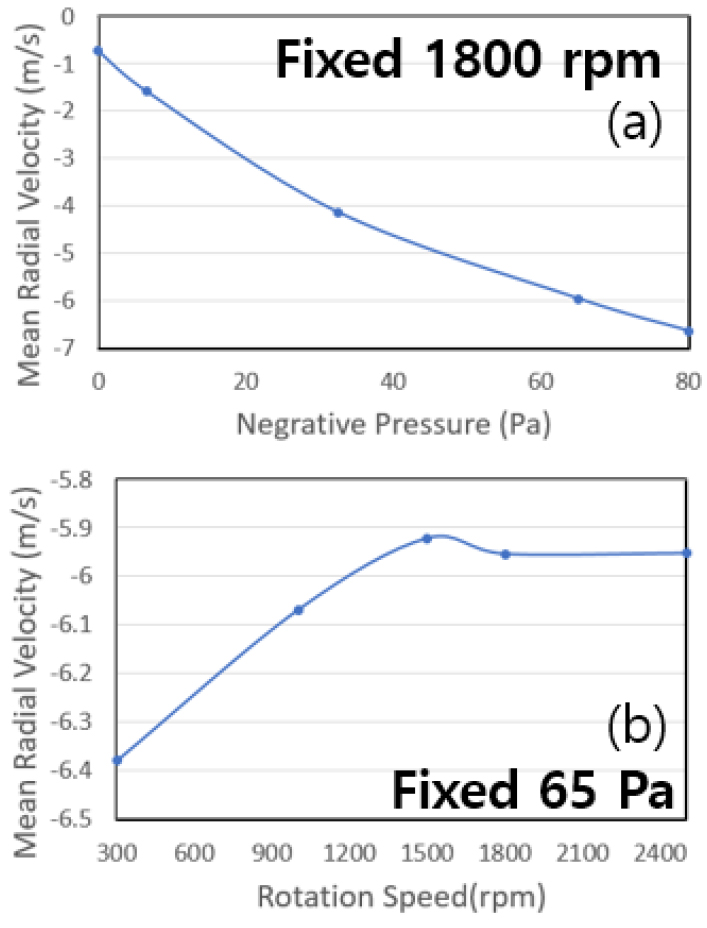
4.2.2 Comparison of radial velocity at guide edge
The radial velocity component at the upper guide edge in the final shape (e) was compared and illustrated in Fig. 10. An increase in exhaust pressure corresponds to an increase in the magnitude of radial back flow. While an increase in rotational speed initially leads to a reduction in radial back flow, a tendency of increase is observed beyond 1500 rpm. This indicates that the influence of exhaust pressure has a significant impact on increasing back flow. On the other hand, the increase in rotational speed initially results in a reduction in radial back flow due to the influence of irregular flow. However, from 1800 rpm onwards, the changes due to irregular flow tend to converge.
4.2.3 Flow rate comparison in radial plane
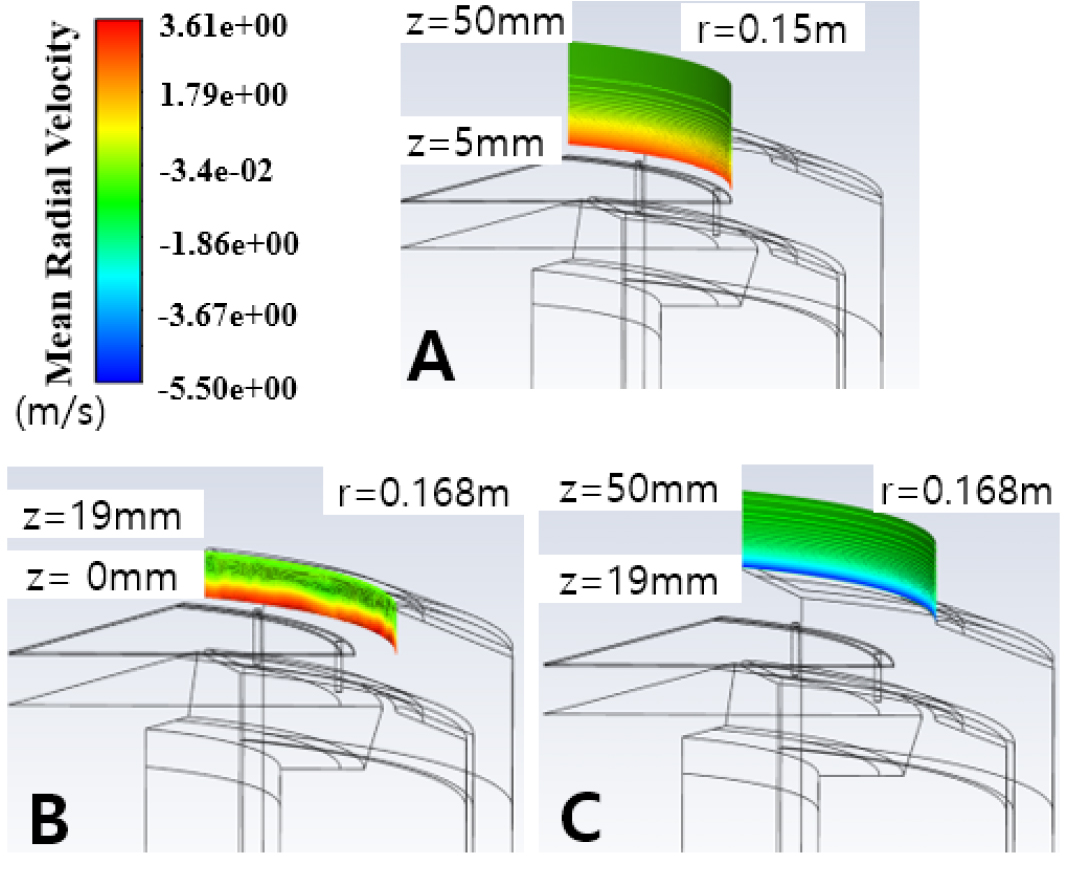
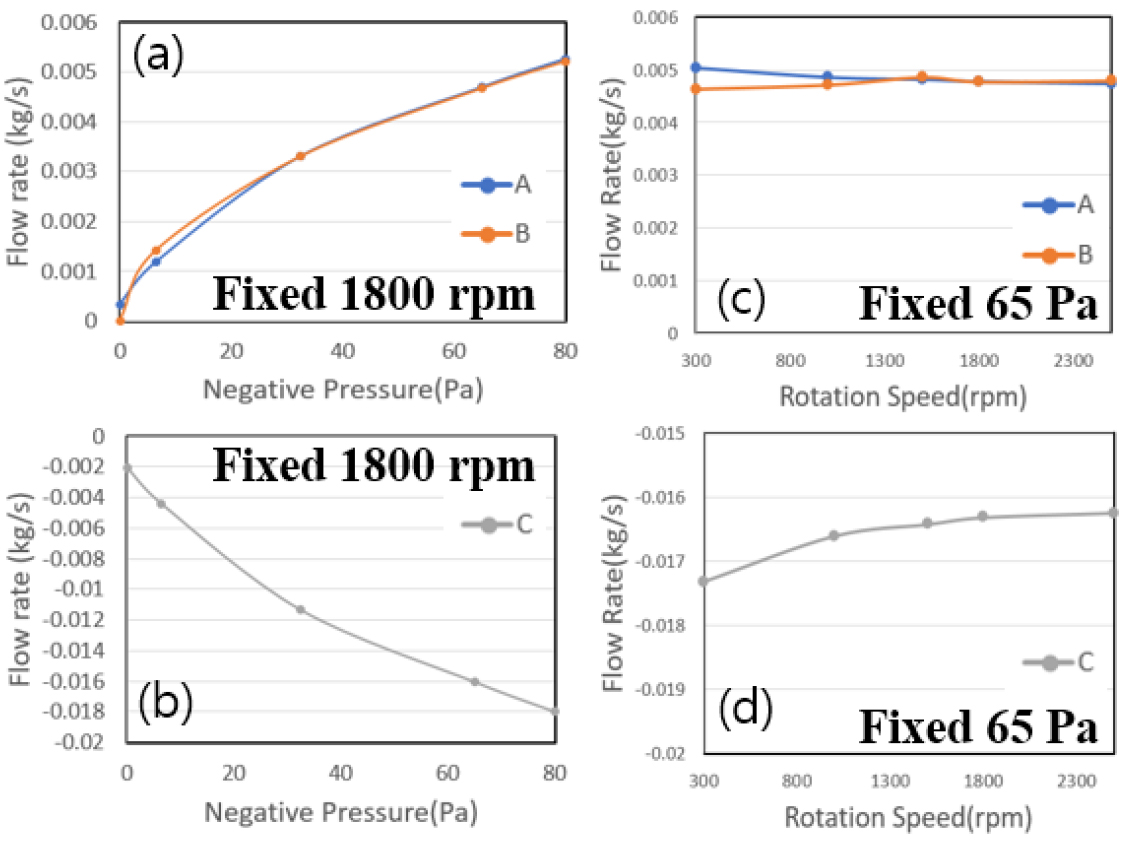
Considering that relying solely on the radial direction velocity at a specific location is insufficient to judge the significant impact of back flow, planes were selected for the radial position, and the flow passing through those planes was analyzed. Fig. 11 illustrates planes created with respect to wafer edge at z = 5 ~ 50 mm. Additionally, planes were generated with respect to the upper guide edge at z = 0 ~ 19 mm and z = 19~50 mm, and the flow results are compared.
In Fig. 12, both planes A and B show a similar trend in flow variation with an increase in exhaust pressure. However, concerning the change in exhaust pressure, plane A slightly decreases, while plane B increases until 1500 rpm and then decreases, converging beyond 1800 rpm. From the results of plane A, it is evident that as the rotational speed increases, the flow decreases due to the influence of back flow. On the other hand, the results from plane B indicate that, starting from 1800 rpm, the flow exiting through the outlet deceases slightly due to the influence of irregular flow, converging beyond a certain point.
4.2.4 Effect of pins
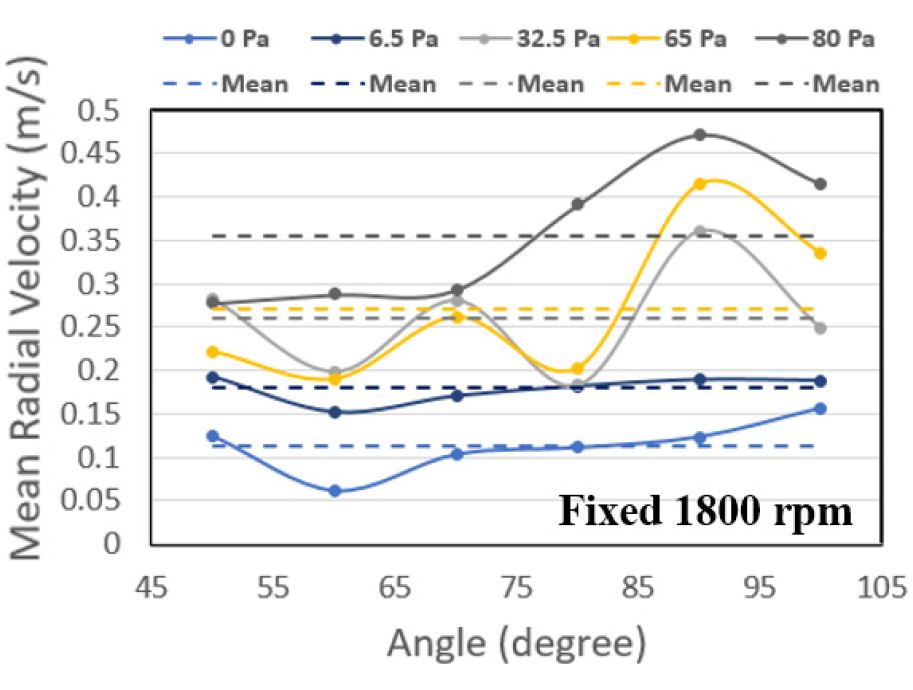
The final configuration (e) possesses an irregular shape in the rotational direction due to the two types of pin shapes. Therefore, radial velocity components were examined based on the angle relative to the rotational center.
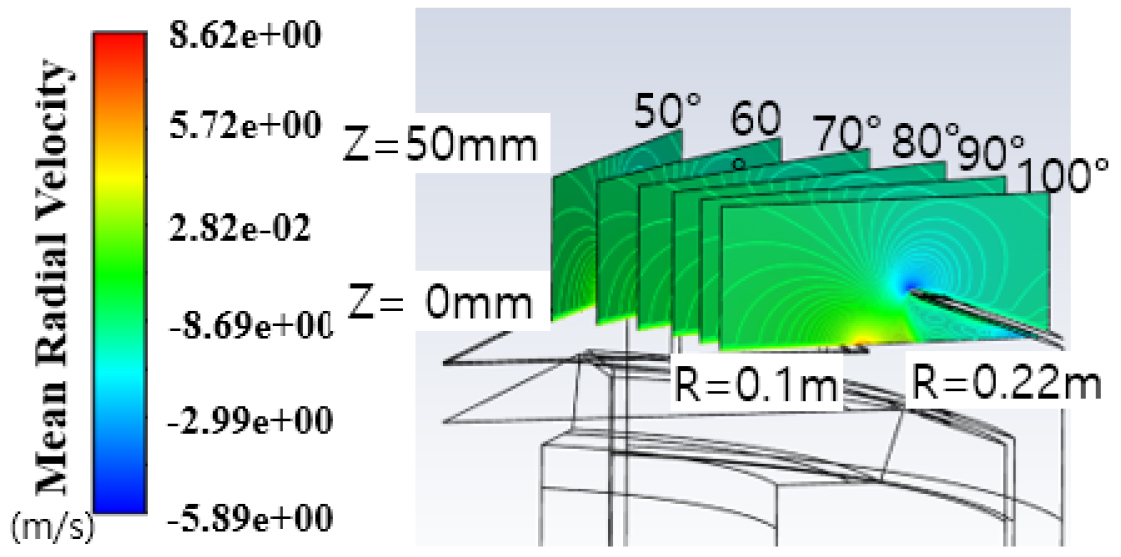
Fig. 13 shows that planes were created at intervals of 10 degrees from 50 degrees to 105 degrees, with radial positions at r = 0.1 ~ 0.2 m and axial positions at z = 0 ~ 50 mm when the domain angle was between 45 to 105 degrees. Fig. 14 represents the mean radial velocity at each plane and the average value for the entire plane.
At the 60-degree position in the domain, there is an sub-pin, while at the 90-degree position, a fixed pin is installed. Examining the results from 300 to 1800 rpm, it can be inferred that significant back flow occurs at the sub-pin location, whereas relatively less back flow is observed at the fixed pin location.
4.2.5 Impact of guide positioning
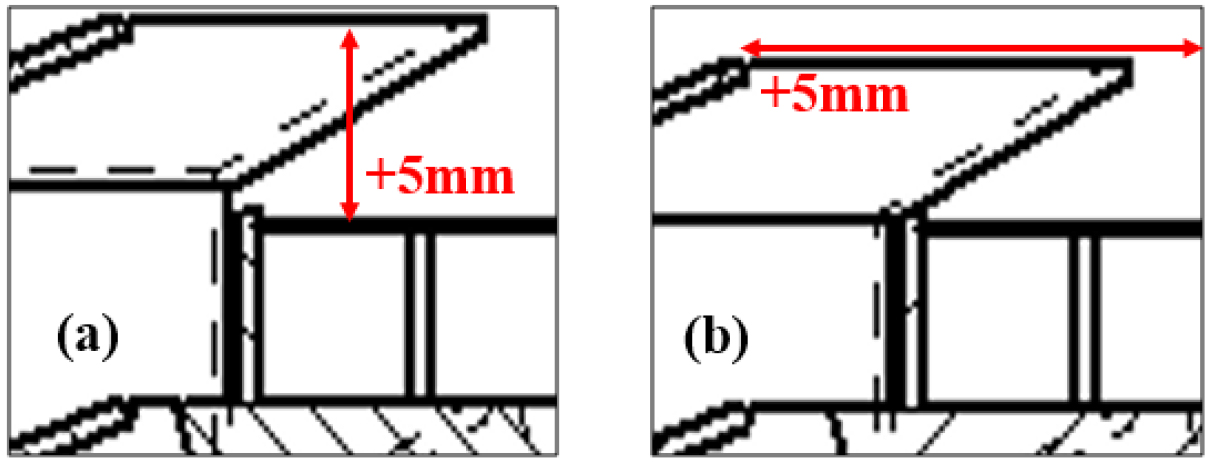
Through the previous Fig. 8, it was revealed that the guide structure induces radial back flow in the rotating disk. We investigated the flow variations by moving the guide edge positions by 5 mm in both the radial and axial directions, as shown in Fig. 15. Referring to shape (e) as the base, the configuration moved 5 mm in the axial direction is defined as shape A*, and the one moved 5 mm in the radial direction is defined as shape B*.
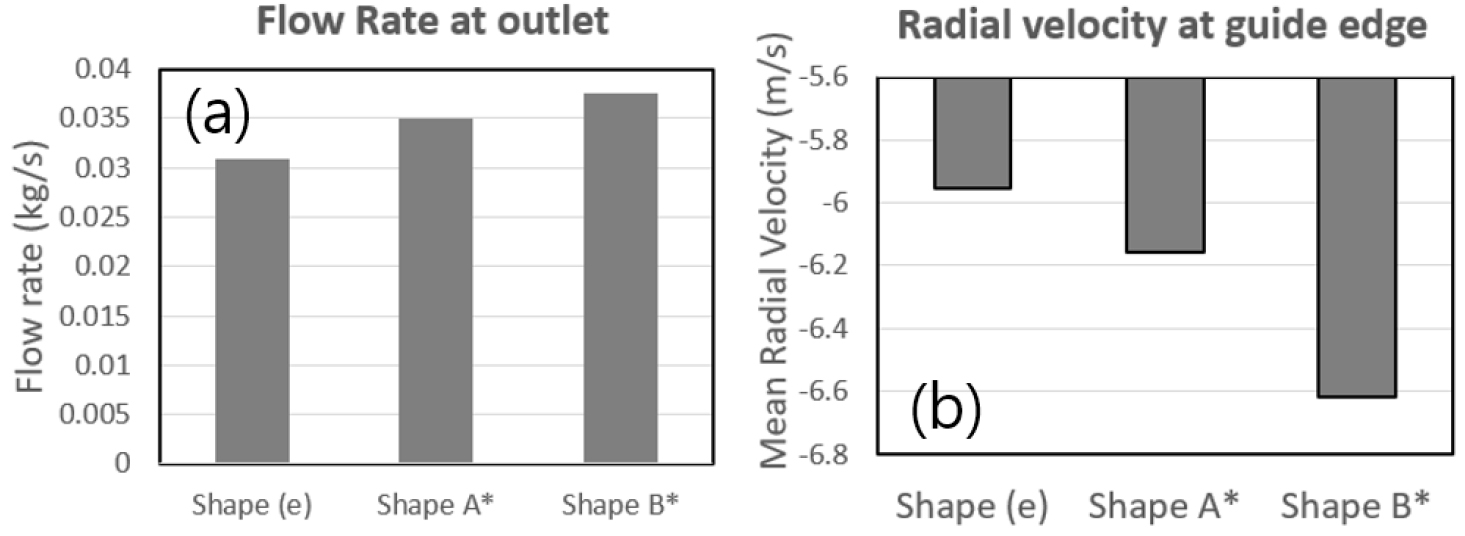
In Fig. 16, when comparing the flow rates exhausted and the radial velocity generated at the guide edge for the three shapes, it can be speculated that the increase in the exhausted flow rate leads to an increase in radial back flow.
To investigate radial back flow, we established identical radial planes, as depicted in Fig. 11, and analyzed the flow rate. Fig. 17 indicates that there was not a significant change in the flow rate at plane A. However, due to the increased radial velocity component at the guide edge, there is an observable tendency for an increase in the flow rate at plane C. Conversely, based on the results from plane B, we can observe that for shape A*, radial back flow decreases, while for shape B*, there is an increase in back flow.
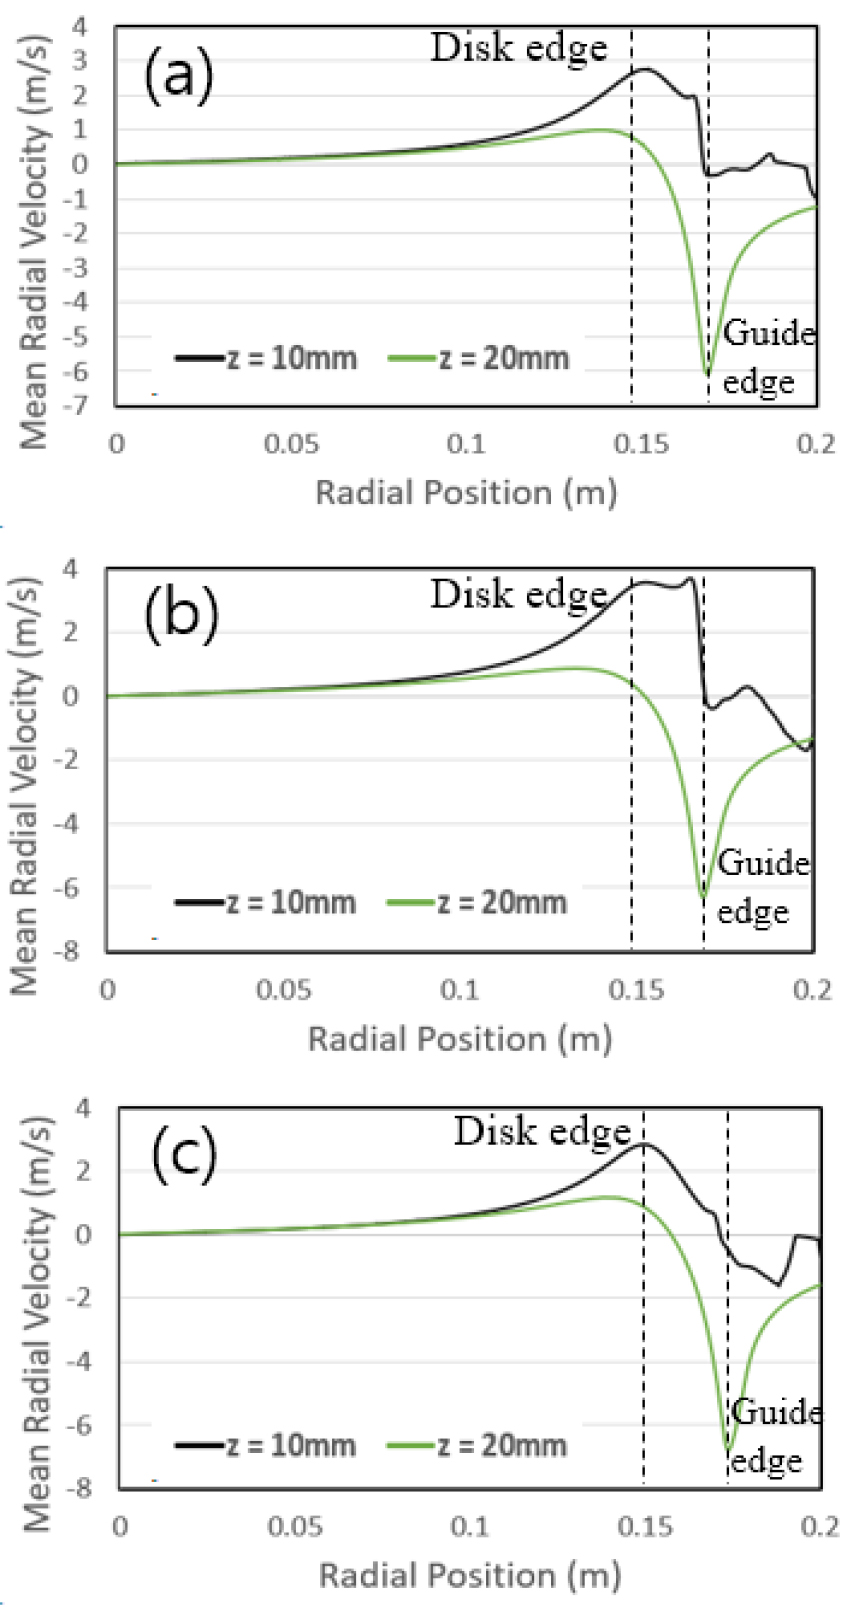
To examine the variations in radial back flow, we generated an x-z plane for an angle of 75 degrees and investigated mean radial velocity concerning radial positions. In Fig. 18, at a height of z = 10 mm, for shape A*, there is an observed increase in radial velocity from the disk edge to the guide edge, while for shape B*, a steep decrease in radial velocity is noticeable.
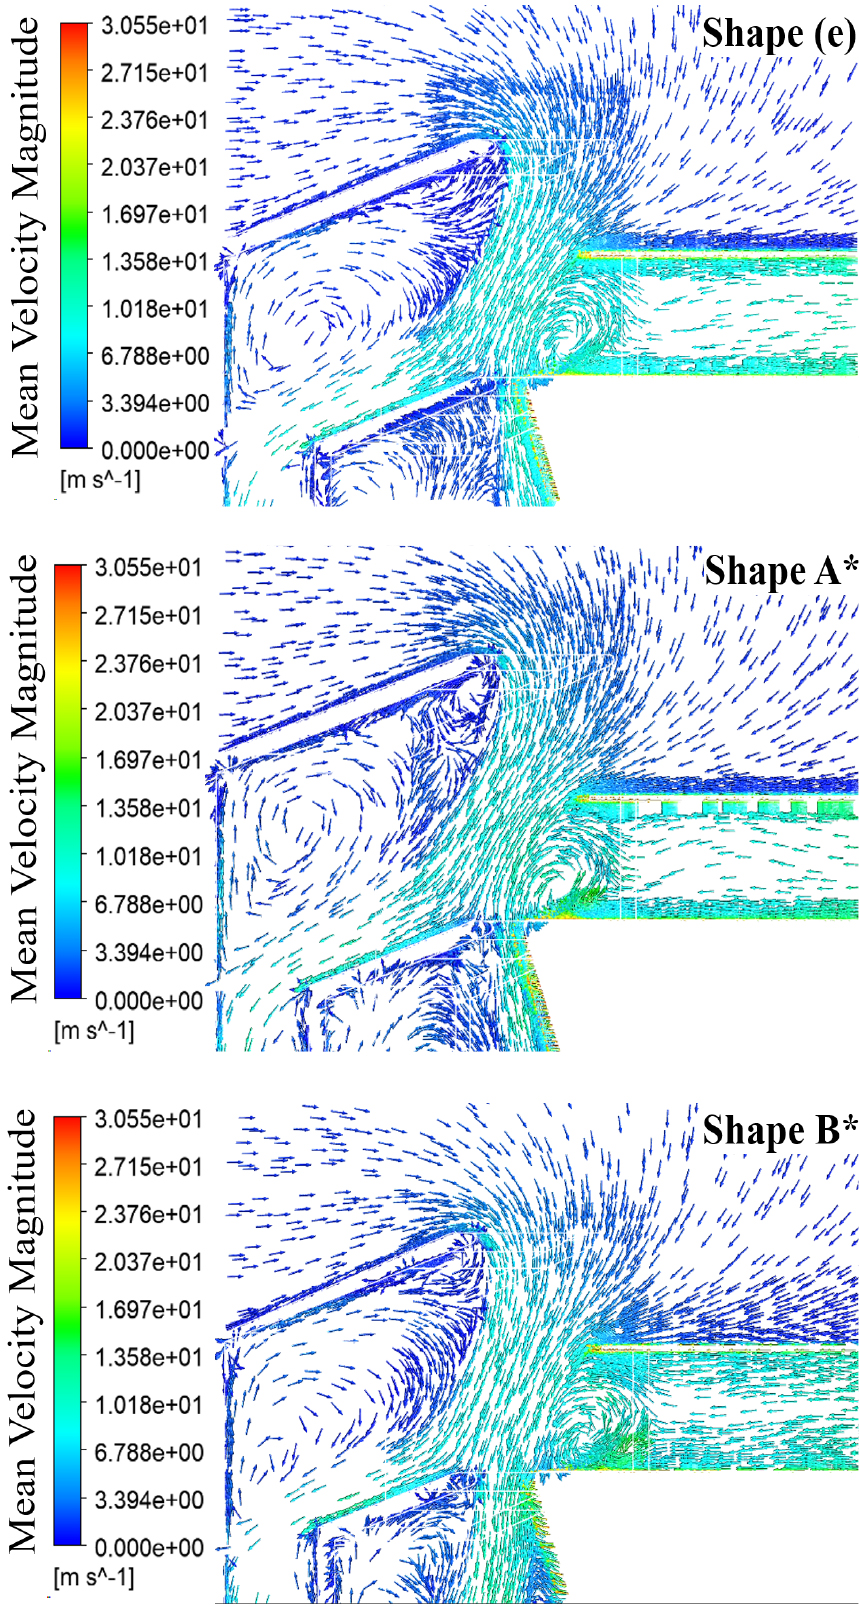
Fig. 18 represents the vector field of mean velocity magnitude for shape (e) and each configuration. In shape A*, as the guide shape shifts axially, changes occur in the vortex flow inside the guide. In the case of shape (e), the influence of the vortex is evident as back flow occurs along the lower part of the guide. For shape A*, the formation of another vortex at the guide edge results in a decrease in radial back flow. On the other hand, for shape B*, the radial shift leads to the maintenance of the vortex inside the guide, coupled with an increased inflow in the axial direction, contributing to an overall rise in radial back Flow.
5. Conclusions
We conducted numerical analysis on the radial back flow generated in the rotating structure and guide structure within a single-wafer wet cleaner. The rotating structure generates radial back flow not on the upper surface of the wafer but is observed on the side of the rotating structure. This occurs due to the radial inflow between coaxial disks, and this flow exhibits a characteristic of increasing the suction flow in the axial direction on the upper surface of the wafer.
The guide structure installed around the rotating structure aims to collect the liquid or gas ejected onto the wafer. Radial back flow is observed in the upper and lower regions of the guide structure, where the upper region is influenced by the axial suction flow generated as the wafer rotates. In contrast, the lower region experiences radial back flow due to the vortex inside the guide. Factors influencing radial back flow, such as exhaust pressure and rotational speed, were observed. An increase in exhaust pressure resulted in an increase in the flow rate exiting the outlet, leading to an observed increase in radial back flow in the upper region of the guide. However, for rotational speed, irregular flow increased above 1800 rpm, but Radial Back flow did not decrease significantly, converging to a certain level.
Regarding the pin shape of the rotating structure, strong back flow was observed at the sub-pin location, while back flow weakened at the guide pin location. To control back flow components, two new guide shapes were proposed. In the case of a guide structure extended in the radial direction, an increase in outlet flow resulted in an increase in back flow in the upper region of the guide, along with an increase in back flow inside the guide. However, due to a significant increase in axial flow, further research is needed to determine if particles can reach the wafer due to back flow in the lower region. Another structure, an axially extended guide structure, showed an increase in back flow in the upper region with an increase in outlet flow. However, a significant decrease in back flow was observed in the lower region of the guide, indicating the formation of a new vortex at the edge, minimizing back flow. Considering the sensitivity of flow inside the guide to small shape changes, additional research is required to achieve precise control of back flow. Furthermore, additional research from a multiphase flow perspective is necessary to verify the actual impact.
